

自作の株価分析ツールで運用を始めたけれど、累計損益だけでは『今月はいくら勝ったのか?』『去年のパフォーマンスはどうだったか?』がパッと分からない……
そんな悩みから、今回はツールのポートフォリオ画面に『年次・月次絞り込み機能』を追加しました。
この記事では、既存のデータベース構造を崩さずに、Python(Flask)とSQLAlchemyを活用して期間集計を実装する方法を解説します。
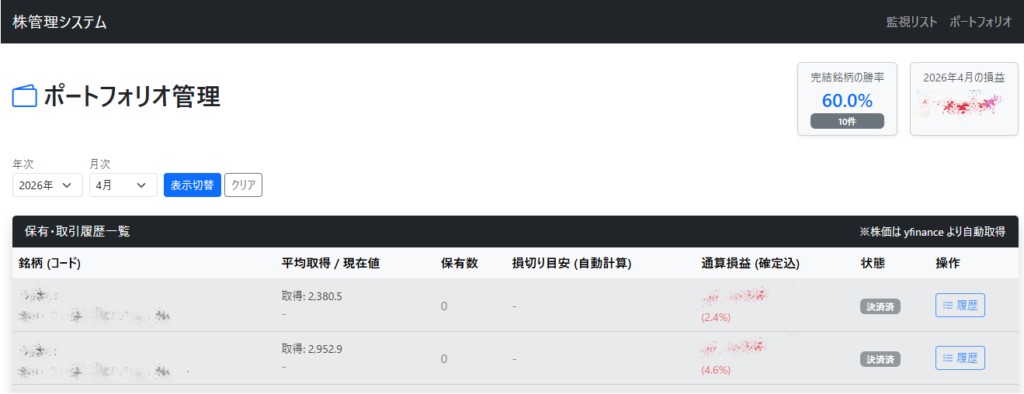
下の画像のように月ごとに成績を切り替えられるようにしました。
現状のテーブル構造を確認
まず、今回の改修に関連するテーブル構造(メインのカラムのみ)を整理します。
| テーブル名 | カラム名 | 型 | 説明 |
|---|---|---|---|
| Trade (売買管理メイン) | symbol | String | 銘柄(コード) |
| name | String | 銘柄 | |
| status | String | [open]:保有中 / [closed]:完結 | |
| TradeHistory (売買履歴) | trade_id | Integer | 外部キー(trade.id) |
| trade_date | Date | 売買が実行された日付 | |
| trade_type | String | [buy]:買い / [sell]:売り | |
| price | Float | 売買価格 | |
| quantity | Integer | 株数 |
ここで重要なのは、銘柄(Trade)テーブルに『決済日』というカラムが存在しないという点です。
実装の戦略
期間集計を実装するにあたり、2つの選択肢がありました。
- 案A: Tradeテーブルに settlement_date カラムを追加する。
- 案B: 売買履歴(TradeHistory)から最新の売却日を逆算する。
今回は『案B』を採用しました。カラムを追加すると過去データの移行やロジックの変更が必要になり、システムが複雑化するため現状のテーブル構造で機能追加することが最も低コストでスマートな解決策だと判断しました。
コード解説
改修前
改修前は、ただDBにある全てのレコードを取得して計算していました。これでは『全期間』の数字しか出せません。
# 一部抜粋
@app.route('/portfolio')
def portfolio():
    trades = Trade.query.all()

    total_realized_profit = 0  # 画面全体の確定損益合計用

    for t in trades:
        total_buy = sum(h.price * h.quantity for h in t.histories if h.trade_type == 'buy')
        total_sell = sum(h.price * h.quantity for h in t.histories if h.trade_type == 'sell')

        if t.status == 'open':
            # 保有中の場合:現在の含み損益を計算
            # ・・・(省略)・・・
        else:
            # 完了済の場合:確定損益を計算
            t.display_profit = total_sell - total_buy
            t.profit_rate = (t.display_profit / total_buy * 100) if total_buy > 0 else 0
            total_realized_profit += t.display_profit

    # 勝率計算
    closed_trades = [t for t in trades if t.status == 'closed']
    win_count = len([t for t in closed_trades if t.display_profit > 0])
    total_closed = len(closed_trades)
    win_rate = (win_count / total_closed * 100) if total_closed > 0 else 0

    return render_template('portfolio.html',
                           trades=trades,
                           win_rate=round(win_rate, 1),
                           total_closed=total_closed,
                           total_realized_profit=total_realized_profit)
改修後
改修後はブラウザから送られてくる『年』と『月』の情報を元に、ループ内で判定処理をはさんでいます。
# 一部抜粋
@app.route('/portfolio')
def portfolio():
    # URLパラメータから年次・月次を取得
    selected_year = request.args.get('year', type=int)
    selected_month = request.args.get('month', type=int)

    trades = Trade.query.all()

    # 初期化
    total_realized_profit = 0
    display_trades = []
    win_count = 0
    total_closed = 0

    for t in trades:
        total_buy = sum(h.price * h.quantity for h in t.histories if h.trade_type == 'buy')
        total_sell = sum(h.price * h.quantity for h in t.histories if h.trade_type == 'sell')

        # 完結銘柄の決済日(最後の売却日)を特定
        settlement_date = None
        if t.status == 'closed':
            sell_dates = [h.trade_date for h in t.histories if h.trade_type == 'sell']
            settlement_date = max(sell_dates) if sell_dates else None

        # --- 期間判定(年次・月次対応) ---
        is_in_period = True
        if t.status == 'closed':
            # 年が選択されている場合:年が一致するかチェック
            if selected_year and (not settlement_date or settlement_date.year != selected_year):
                is_in_period = False
            # 月が選択されている場合:月が一致するかチェック
            if selected_month and (not settlement_date or settlement_date.month != selected_month):
                is_in_period = False
        # --------------------------------

        if t.status == 'open':
            # 保有中の場合:現在の含み損益を計算
            # ・・・(省略)・・・

        elif t.status == 'closed' and is_in_period:
            # 決済済みかつ、選択した「年」や「月」に合致する場合
            t.display_profit = total_sell - total_buy
            t.profit_rate = (t.display_profit / total_buy * 100) if total_buy > 0 else 0

            total_realized_profit += t.display_profit
            total_closed += 1
            if t.display_profit > 0:
                win_count += 1

            display_trades.append(t)

    win_rate = (win_count / total_closed * 100) if total_closed > 0 else 0

    return render_template('portfolio.html',
                           trades=display_trades,
                           win_rate=round(win_rate, 1),
                           total_closed=total_closed,
                           total_realized_profit=total_realized_profit,
                           selected_year=selected_year,
                           selected_month=selected_month)
① URLパラメータで期間指定
selected_year = request.args.get('year', type=int)
selected_month = request.args.get('month', type=int)
『ポートフォリオ』画面のフォームで指定された年・月を、URLのクエリパラメータから取得するためのコードです。もしパラメータが指定されていない場合はエラーにならず、自動的に[None]が代入されるため、全期間表示などの条件分岐もスムーズに行えます。
- request.args.get: URLの末尾(?year=2026…)に付与されたデータを取得します。
- type=int:取得したデータは通常「文字列」ですが、後の集計処理で計算や比較がしやすいよう、その場で数値(整数型)に変換しています。
② 最終売却日を決済日として扱う
sell_dates = [h.trade_date for h in t.histories if h.trade_type == 'sell']
settlement_date = max(sell_dates) if sell_dates else None銘柄の全取引履歴から売却日だけをリストとして抽出し、その中で最も新しい日付を『決済完了日』として取得するコードです。DBに『決済日』というカラムを新設せず、既存の履歴データから動的に計算する効率的な実装です。
- 1行目(リスト内包表記):履歴(histories)をループし、trade_type が [sell]のデータから日付(trade_date)だけを集めます。
- 2行目 (max 関数):抽出した売却日リストの中から最大値(最新の日付)を取り出します。リストが空(未売却)の場合は、エラーを避けるため None を代入します。
③ 期間フィルタの追加
is_in_period = True
if t.status == 'closed':
    if selected_year and (not settlement_date or settlement_date.year != selected_year):
        is_in_period = False
    if selected_month and (not settlement_date or settlement_date.month != selected_month):
        is_in_period = False
取引が終了した銘柄(closed)に対して、『指定された集計期間に合致するか』を判定するロジックです。
これにより、保有中の銘柄は常に表示しつつ、利益確定済みの銘柄だけを狙った期間で絞り込むことができます。
- 初期値:まず is_in_period = True とし、表示対象として扱います。
- 年・月の不一致チェック:ユーザーが年や月を選択している場合、算出した「決済日(settlement_date)」と照らし合わせます。
- フラグの更新:もし決済日が選択された年・月と異なる(または決済日が特定できない)場合は、False に書き換えて表示対象から除外します。
④ 対象トレードのみ集計
elif t.status == 'closed' and is_in_period:
    t.display_profit = total_sell - total_buy
    t.profit_rate = (t.display_profit / total_buy * 100) if total_buy > 0 else 0

    total_realized_profit += t.display_profit
    total_closed += 1
    if t.display_profit > 0:
win_count += 1『決済済みかつ表示期間内』と判定された銘柄に対して、利益額・利益率の算出と、期間全体の合計成績への加算を行う処理です。この処理により、絞り込んだ期間内だけの正確な合計損益や勝率を、画面上で一目で確認できるようになります。
- 損益の計算:売却総額から購入総額を引いて利益額(display_profit)を出し、それをもとに利益率を算出します。
- 全体集計への蓄積:算出した利益を期間全体の確定損益(total_realized_profit)に加算し、取引件数(total_closed)をカウントアップします。
- 勝率の判定:利益がプラスであれば勝ち数(win_count)としてカウントし、後の勝率計算に繋げます。
フロント側の改善
期間を絞り込めるフォームタグを追加しました。
<form action="/portfolio" method="GET" class="row g-2 mb-4 align-items-end">
    <div class="col-auto">
        <label class="small text-muted">年次</label>
        <select name="year" class="form-select form-select-sm">
            <option value="">累計</option>
            <option value="2025" {% if selected_year == 2025 %}selected{% endif %}>2025年</option>
            <option value="2026" {% if selected_year == 2026 %}selected{% endif %}>2026年</option>
            <option value="2027" {% if selected_year == 2027 %}selected{% endif %}>2027年</option>
        </select>
    </div>
    <div class="col-auto">
        <label class="small text-muted">月次</label>
        <select name="month" class="form-select form-select-sm">
            <option value="">全期間</option>
            {% for m in range(1, 13) %}
            <option value="{{ m }}" {% if selected_month == m %}selected{% endif %}>{{ m }}月</option>
            {% endfor %}
        </select>
    </div>
    <div class="col-auto">
        <button type="submit" class="btn btn-sm btn-primary">表示切替</button>
        <a href="/portfolio" class="btn btn-sm btn-outline-secondary">クリア</a>
    </div>
</form>
まとめ
今回の改修を通して、改めて『データの可視化』の重要性を実感しました。月次集計の機能を追加したことで自分のトレード手法の好不調が客観的に見えるようになりました。
- 決済日は「最終sell日」で取得する。
- exit_dateベースで集計する。
- URLパラメータで期間を切り替える。

【投資に関する免責事項】
本ブログで紹介している株価解析ツールによるスコアリングおよび銘柄分析は、あくまで個人の学習・研究および技術検証を目的としたものであり、特定の銘柄の売買を推奨するものではありません。
ツールの算出結果や掲載情報の正確性については万全を期しておりますが、その内容を保証するものではありません。投資の最終決定は、必ずご自身の判断と責任において行っていただきますようお願いいたします。
万一、本ブログの情報に基づいて被ったいかなる損害についても、当サイトおよび運営者は一切の責任を負いかねますのであらかじめご了承ください。